Responder analyses can be misleading for evaluating treatment effects from continuous variable endpoints. Rather, anchor-based analyses of continuous variable endpoints should be used to evaluate the clinical meaningfulness of observed treatment effects in clinical trials.
Subgroup analyses of pooled data from the STEP- HFpEF (Research Study to Investigate How Well Semaglutide Works in People Living With Heart Failure and Obesity) trials[1] included “responder analyses” (eg, proportion of participants experiencing changes [eg, ≥20] in the Kansas City Cardiomyopathy Questionnaire Clinical Summary Score [KCCQ-CSS] from baseline to week 52) to evaluate semaglutide’s effect on how participants feel. The investigators conclude that semaglutide produced similar, clinically meaningful improvements in heart failure symptoms in both sexes. Responder analyses also appear in a description of the treatment effect of finerenone on Kansas City Cardiomyopathy Ques- tionnaire Total Symptom Score (KCCQ-TSS) in the FINEARTS-HF trial (FINerenone trial to investigate Efficacy and sAfety superioR to placebo in paTientS with Heart Failure),[2] where the investigators conclude that finerenone improved the health status of patients.
Dichotomizing continuous data by applying thresholds, for example, ≥20 change in KCCQ summary scores, can lead to inaccurate interpretations of effcacy.[3] The responder analyses reported by these investigators are derived from vertical differences between cumulative distribution function (CDF) curves (see Figure 1 for examples), which are dependent on the shape of underlying distributions—the narrower the underlying distributions (or the steeper the slopes of the CDFs), the larger the potential observed responder effect. That is, the vertical difference at a responder threshold has more to do with the variability within the groups than it does with the meaningfulness of between-group differences. In other words, the vertical differences are not reliable estimates of a meaningful treatment effect, as they are dependent on the shape of the curve and threshold applied, and are numerically amplifed when the threshold for the "responder" defnition lies between the medians of the 2 trial arms. Large responder effects falsely exaggerate small, clinically insignifcant changes in mean treatment differences. Where a study is abundantly powered to detect small differences, thresholds placed near the tails will also lead to progressively larger ratios of responders on treatment to responders on placebo. Moreover, because of high within-patient variability, the same participants would not consistently appear in the tails if the trial were repeated.
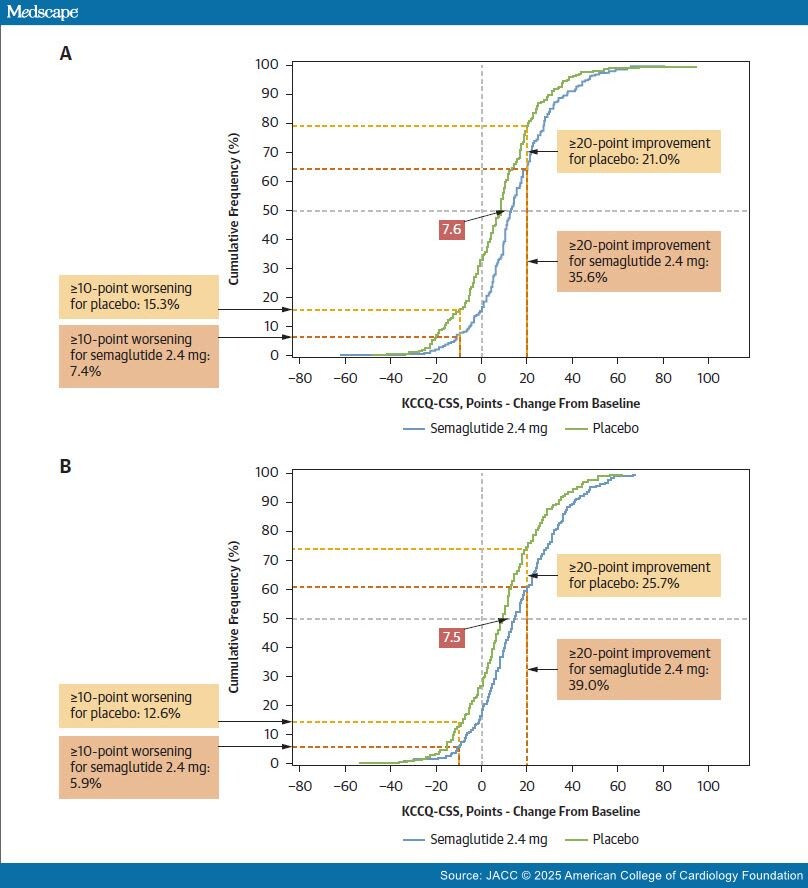
Figure 1. Graphical Depictions of Mean Treatment Differences and Responder Analyses on Cumulative Distribution Function Curves
The responder analysis described in Verma et al1 is a comparison (vertical distance between cumulative distribution function [CDF] curves) of the proportion of participants (women [A]; men [B]) experiencing some level of change in Kansas City Cardiomyopathy Questionnaire Clinical Summary Score (KCCQ-CSS) score (x-axis); such responder analyses are misleading as descriptions of clinically meaningful effects. For example, in B, the fewer placebo participants (25.7%) vs semaglutide participants (39.0%) that experienced a ≥20-point improvement in KCCQ-CSS score is not evidence of a meaningful treatment effect in isolation. A better method for assessing clinical meaningfulness is to examine the mean treatment difference between semaglutide and placebo, best visualized by the horizontal separation of the CDF curves (eg, 7.5 and 7.6 shown superimposed on CDF curves for KCCQ-CSS change from baseline).
Where 2 CDF curves are parallel, that is, when the underlying distributions are of similar shape, as in the pooled STEP-HFpEF analysis, there is likely no true responder group—a subgroup of patients with a differential treatment effect relative to the overall treated population. Here, the treatment effect is best characterized by the mean difference and 95% CI between the treatment groups. This was the primary efficacy endpoint for the STEP-HFpEF trials, approximated by the horizontal separation of the CDF curves (Figure 1). STEP-HFpEF[4] investigators found a mean 7.8 (95% CI: 4.8-10.9) point improvement in KCCQ-CSS at 52 weeks for semaglutide vs placebo; similar to STEP-HFpEF-DM (Research Study to Look at How Well Semaglutide Works in People Living With Heart Failure, Obesity and Type 2 Diabetes).[5]
To provide increased con?dence that a study's observed mean treatment effect would be perceived by patients as a clinically meaningful change, we recommend use of an appropriate anchor scale.
Anchor scales should be simple and assess health states that are readily understood on their own (improved, much improved, etc), using a minimum number of categories so the differences in health states have face validity. For such a well-correlated, sparsely parsed anchor scale, a 1-anchor-unit change could be generally considered clinically meaningful.[6] In STEP-HFpEF, the 1-anchor-unit patient global impression of severity improvement indicated that a 16.3-point KCCQ-CSS change is clinically meaningful. This KCCQ-CSS threshold for clinical meaningfulness is considerably larger than semaglutide's treatment effect.
In FINEARTS-HF, the investigators did not report an anchor-based analysis to estimate the clinically meaningful treatment effect on KCCQ-TSS but found a mean improvement of 1.6 points (95% CI: 0.7-2.6 points), an exceedingly small effect. The probability density function curves of change in KCCQ-TSS at 12 months for each treatment group appear nearly superimposed, consistent with the very small treat- ment effect and no true responder group. We note that in a large study, like FINEARTS-HF, even with very small statistically significant mean differences between groups, most threshold-based analyses would show more "responders" in the active treatment group. We question the threshold selected by the FINEARTS investigators (≥5 points) as clinically meaningful change in KCCQ-TSS and believe the responder analysis does not accurately reflect finerenone's perceivable effect on patients' symptoms.
Improving how patients feel and function are important clinical benefits for heart failure therapies. However, evaluation of symptomatic or functional benefit using continuous variable outcomes should use an approach with anchor-based analysis methods in the patient population of interest. Absent clear evidence for a clinically meaningful effect or a between-group difference in the skewness of the distributions of responses (which would indicate the potential for a true responder group), we question the use of responder analyses as descriptors of treatment bene?ts based on continuous outcomes, despite the visual appearance of vertical differences that are tempting to interpret as meaningful.
J Am Coll Cardiol © 2024